


 USER GUIDE · EN
You can open a position in StereoTrader with a Market Order or a Market Trail Order (MTO), which you place with Shift-click (see below). A Market Order is executed immediately at the currently available market price. You only set the direction and size, not a price. If you want to wait for a specific price instead, use a Pending Order. Chapter 07 describes these orders.
The trading panel#
You place Market Orders in the trading panel on the right side of the chart. The current price is shown at the top, with the spread row below it. The price area is the click target for the order: its left half is for BUY, and its right half is for SELL.
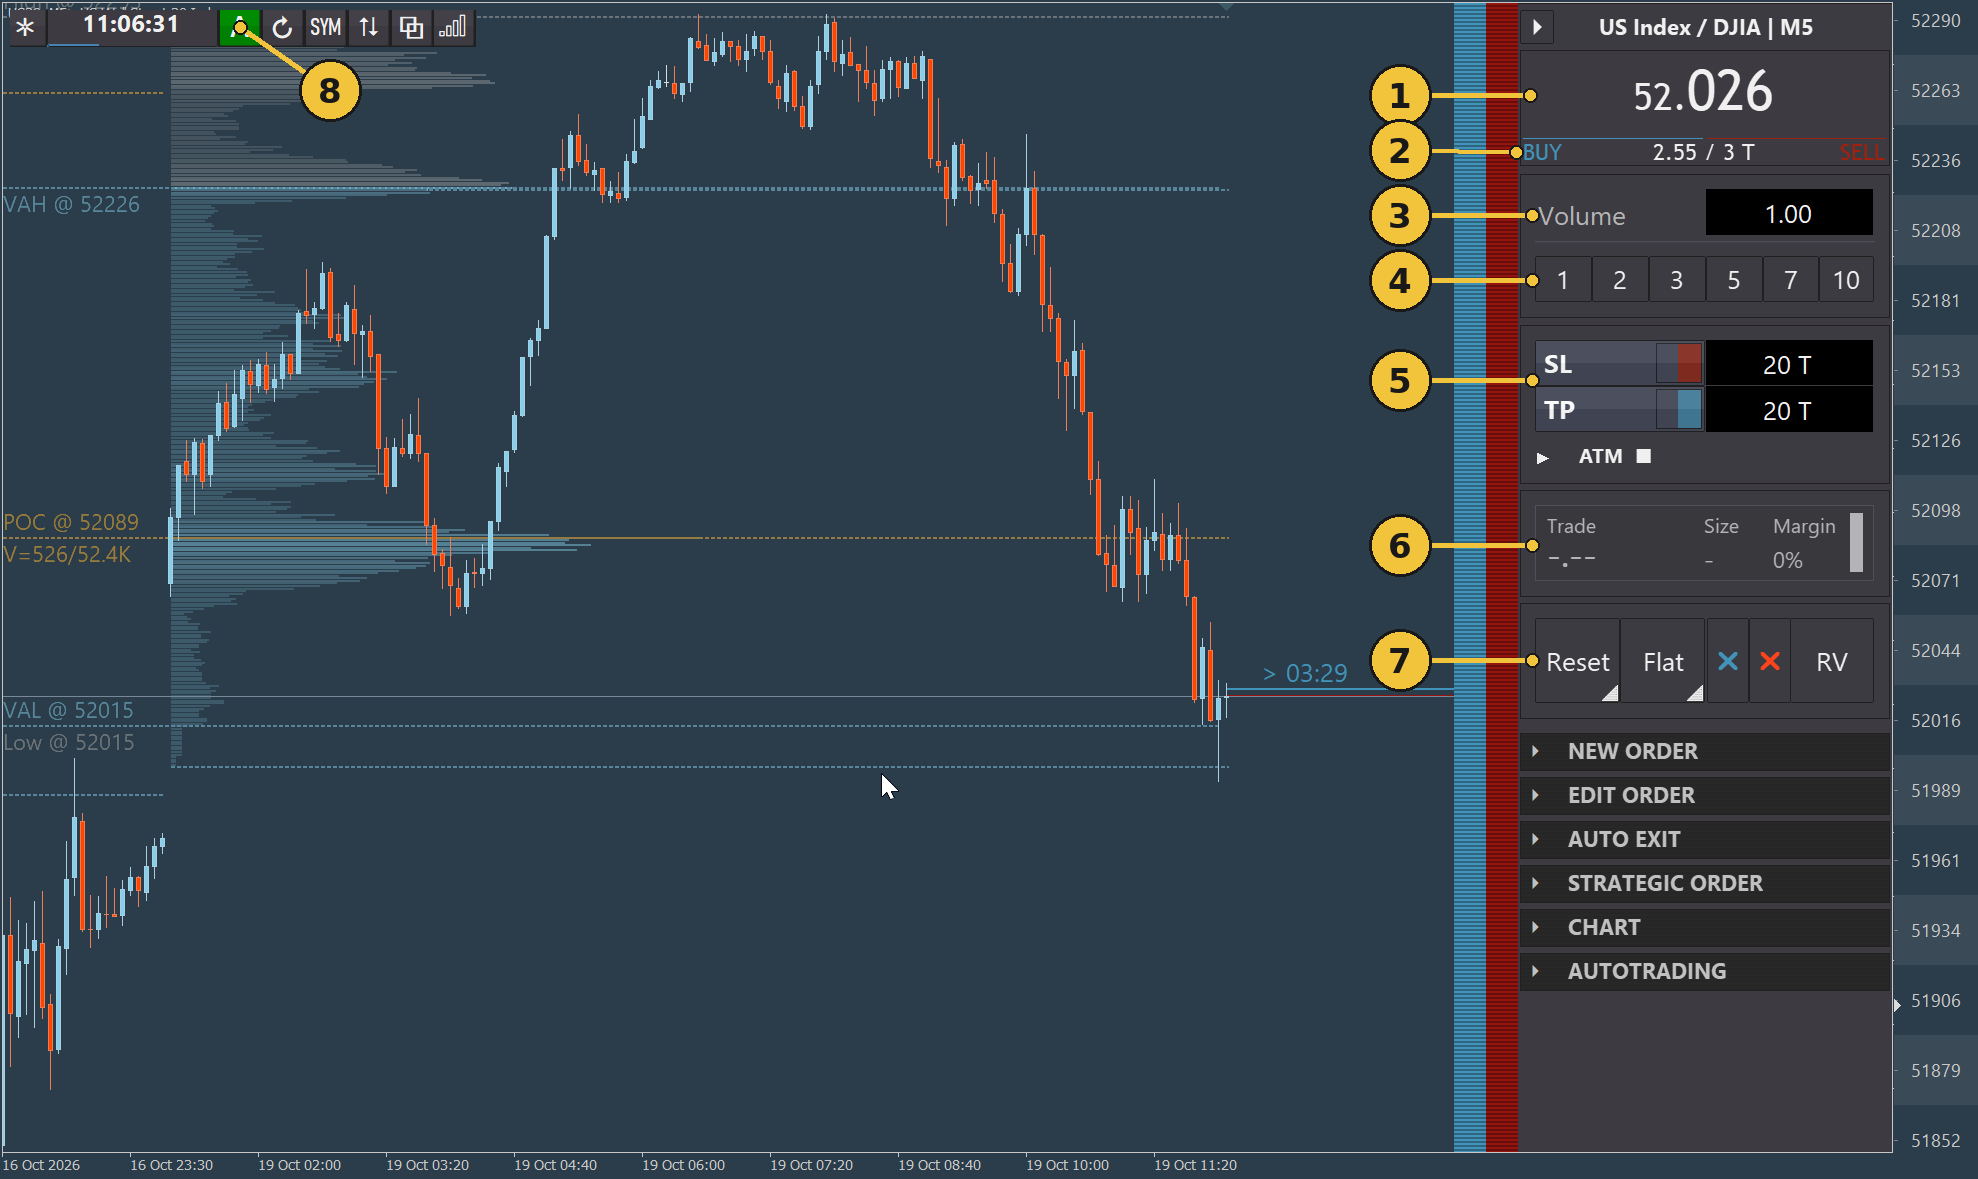
| No. | Label | Description |
|---|---|---|
| 1 | Price area | Shows the current price. Click the left half to send a Market Order with BUY, or the right half for SELL. |
| 2 | BUY / SELL and spread row |
BUY is on the left and SELL on the right. The row below shows the spread—the difference between the Buy and Sell prices—as a price value and in ticks (T). An asterisk * after the value indicates that commission is included. If the spread exceeds the configured limit, the display turns red. |
| 3 | Volume |
Shows the size of the next order in lots. Enter the size directly here. |
| 4 | Quicksize buttons (1, 2, 3, 5, 7, 10) |
Apply a preset size to the next order. Chapter 13 explains which sizes are available. |
| 5 | SL / TP / ATM |
Stop Loss (SL) and Take Profit (TP) are specified in ticks. The ATM (Advanced Trade Management) area contains additional protection settings. See Chapter 06 for trade management. |
| 6 | Trade / Size / Margin |
For an open position, shows the trade result (Trade) and position size (Size). Margin shows how much of the account margin is being used, as a percentage and a bar. When no position is open, Trade and Size show placeholders. |
| 7 | Reset / Flat / X / X / RV |
Quick actions for the current chart. The blue X deletes all Buy Pending Orders on the chart; the red X deletes all Sell Pending Orders. Chapter 05 explains the other actions. |
| 8 | Green A |
The green A in the chart bar at the top left indicates that the chart is active. You can place orders only on an active chart. |
Setting the position size#
The size of the next Market Order is shown in the Volume field, in lots. A lot is MetaTrader's standard unit for order size; the amount of the instrument represented by one lot depends on the instrument.
You can set the size in two ways:
- Enter it directly: Type the value you want in
Volume, for example1.00. - Use a Quicksize button: Click one of the buttons below the field to apply a preset size to the next order.
The size applies to the next order. Check the value in Volume before clicking BUY or SELL each time.
Placing a BUY or SELL order#
BUY opens a Buy position (Long position), which benefits when the price rises. SELL opens a Sell position (Short position), which benefits when the price falls.
To place a Market Order:
- Check the size in
Volume. - Click the left half of the price area for
BUY, or the right half forSELL.
The click sends the order immediately. If trading is disabled on the chart, StereoTrader does not send an order and displays a message instead.
You can reverse which half corresponds to each side in the global settings. See Chapter 14 for details.
Important: A Market Order is executed without another step. Check the direction and size before clicking.
Example: Open a 1-lot BUY position and increase it to 3 lots#
This example starts with a 1-lot BUY position. A second order of 2 lots increases the total position to 3 lots.
- Open the chart for the instrument you want. The trading panel is on the right side of the chart.
- Make sure the chart is active. The green
Aindicates this state. Chapter 13 explains how to switch between states. - Set
Volumeto1.00. - Click the left half of the price area labeled
BUY. The order is sent immediately. You now have a BUY position of 1.00 lot. - Hold down
Ctrland clickBUYagain. The new order is for 2.00 lots: the 1.00 inVolumeplus the 1.00 lot already open. The total open size is now 3.00 lots. The Ctrl-click section explains this behavior.
You can identify the position by its line on the chart and the values in the trading panel (see the next section).
Use the same steps with the right half of the price area to open a SELL position.
Identifying an open position on the chart#
Once the order is executed, StereoTrader displays the position as a line on the chart. The line shows its direction, size, and result. The trading panel also displays the position values.
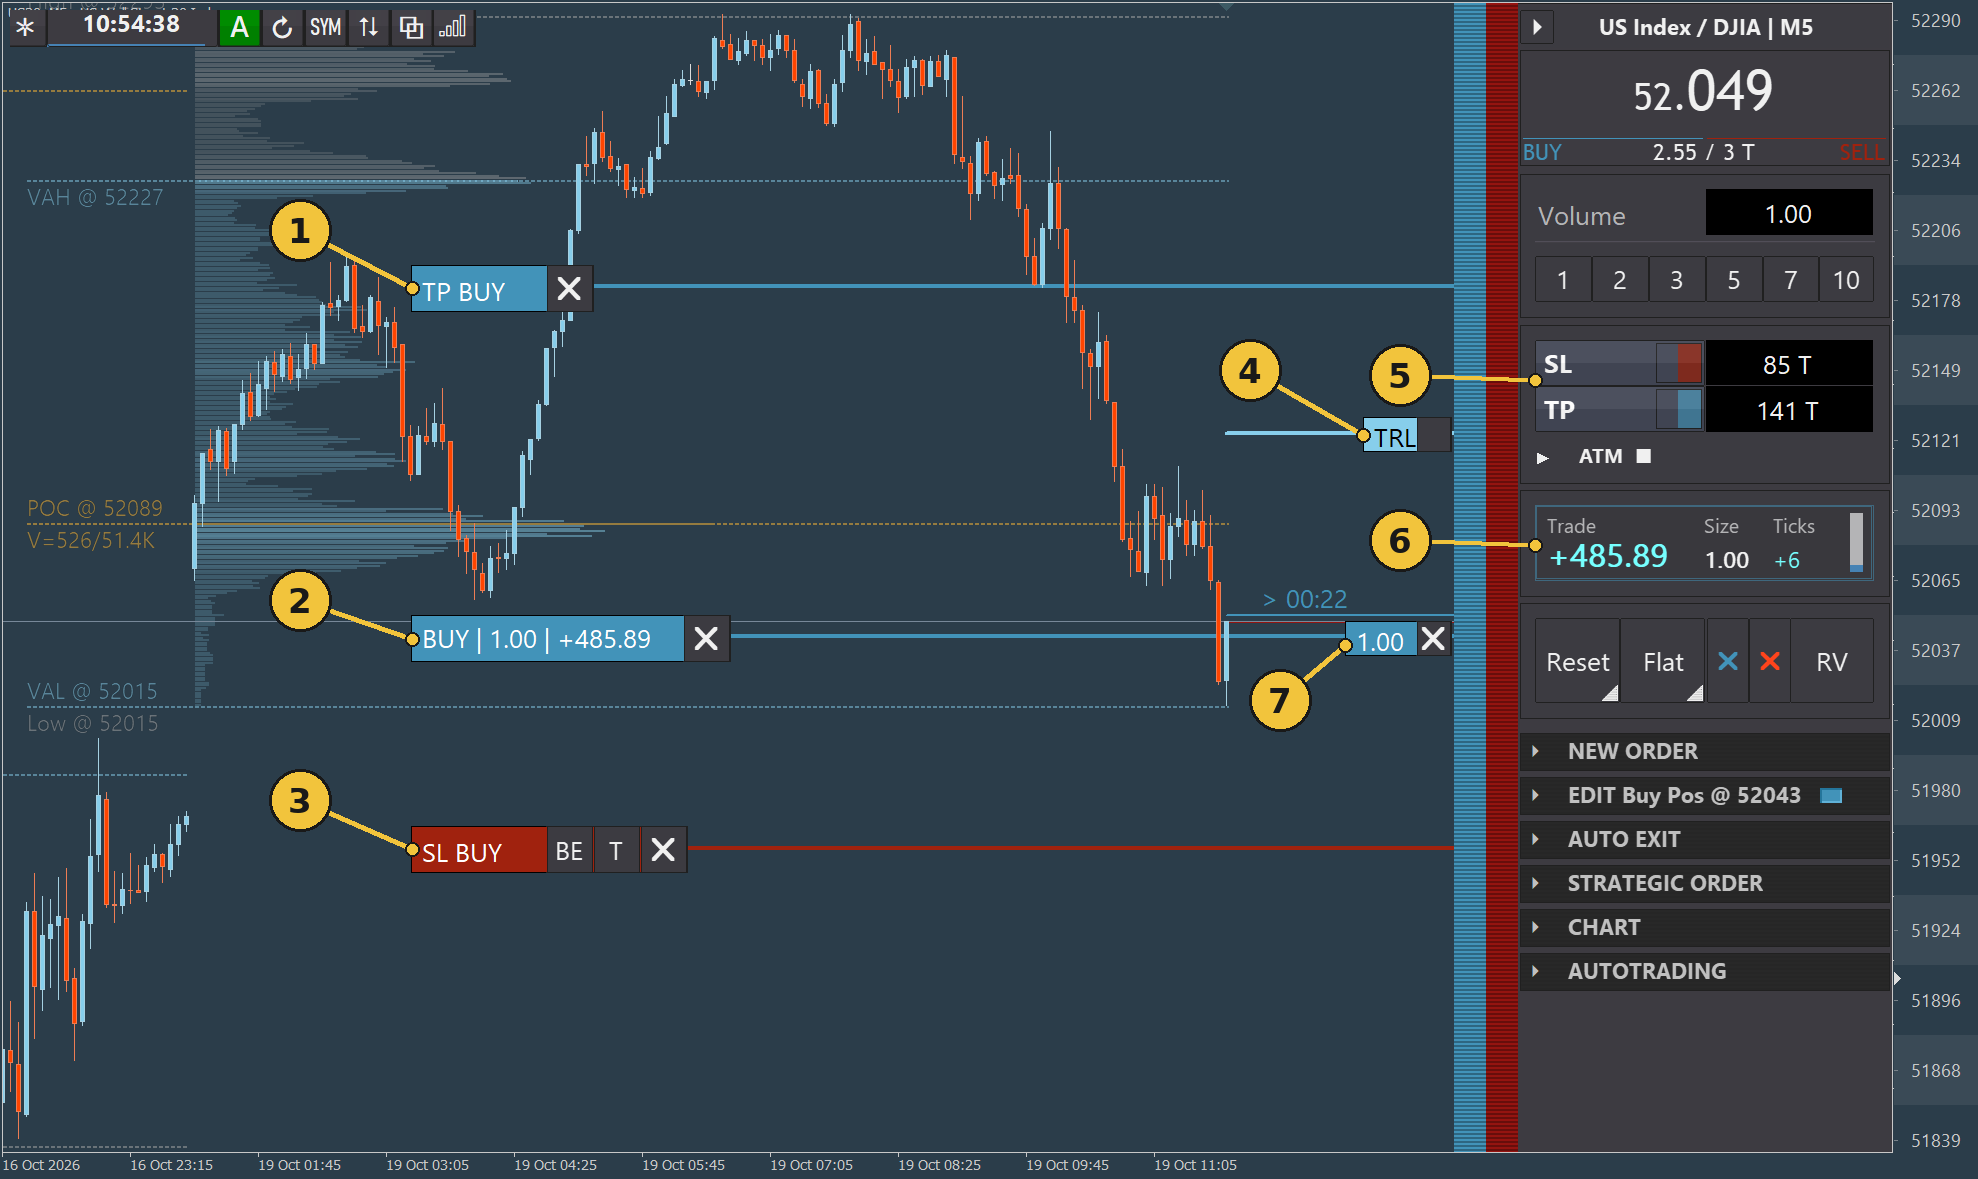
| No. | Label | Description |
|---|---|---|
| 1 | TP BUY |
Marks the Take Profit (TP) for the BUY position. Chapter 06 explains how to edit it. |
| 2 | BUY | 1.00 | +485.89 |
The position line shows the direction (BUY), total size (1.00), and position result (+485.89). These figures are examples from the illustration. |
| 3 | SL BUY / BE / T |
Marks the Stop Loss (SL). BE means Break Even, and T means ticks. See Chapter 06 for management. |
| 4 | TRL |
Marks the position's Trail line. Chapter 06 explains how it works. |
| 5 | SL / TP with ticks |
Show the distance in ticks from the current price to Stop Loss (85 T) and Take Profit (141 T). |
| 6 | Trade / Size / Ticks |
Shows the trade result (Trade, +485.89), position size (Size, 1.00), and result in ticks (Ticks, +6). |
| 7 | Partial-position marker 1.00 with X |
Shows the partial position size at the right edge of the chart. The X button is part of position management; see Chapter 05 and Chapter 06. |
The values for SL and TP change with the current price. The Stop Loss and Take Profit price levels on the chart, however, stay in the same place.
After another order, the total position size increases. The next illustration shows the same BUY position at a total of 3.00 lots. Volume is still set to 1.00. The total position consists of two partial positions: one of 1.00 lot and one of 2.00 lots.
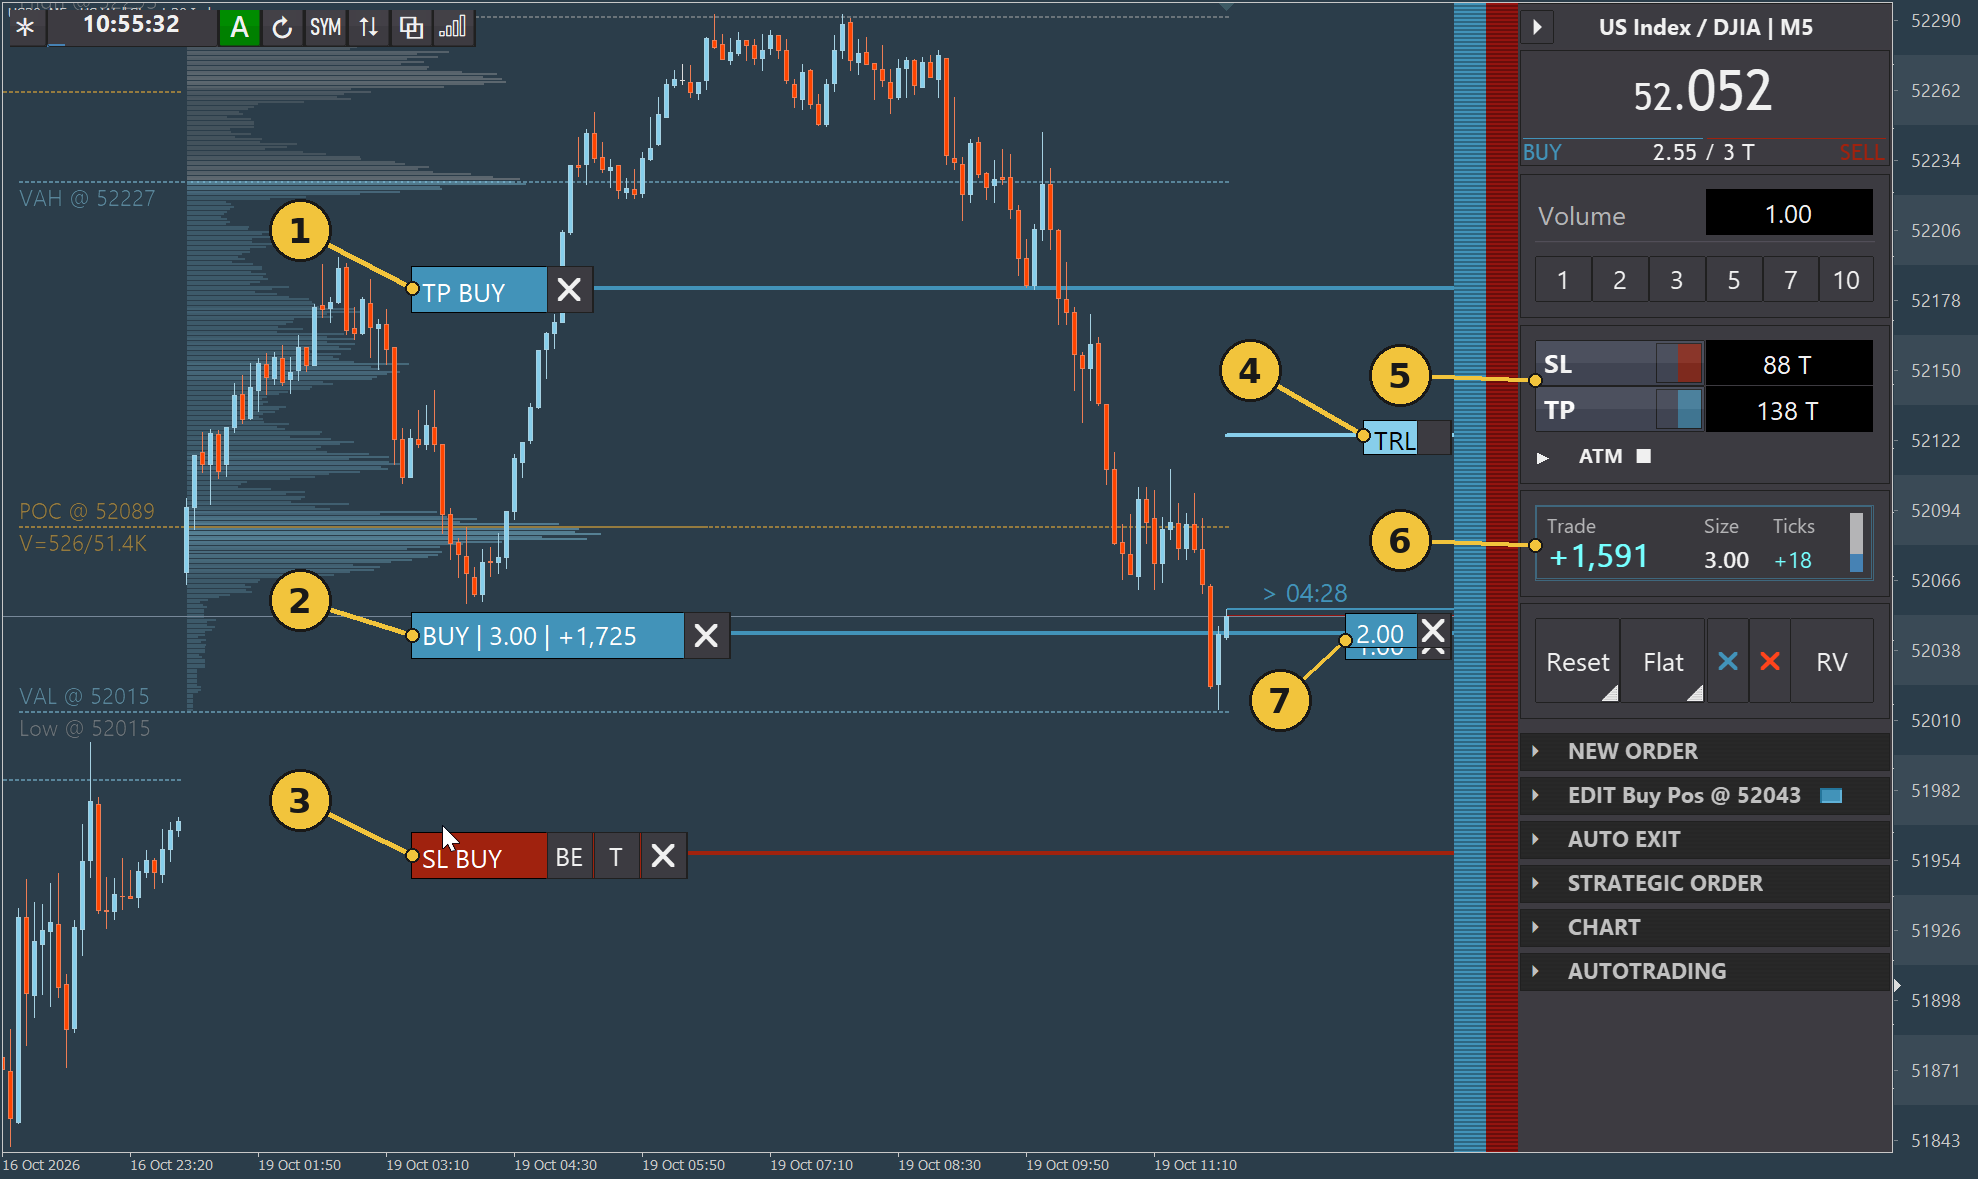
| No. | Label | Description |
|---|---|---|
| 1 | TP BUY |
Marks the Take Profit (TP) for the BUY position. Chapter 06 explains how to edit it. |
| 2 | BUY | 3.00 | +1,725 |
The position line shows the direction (BUY), total size (3.00), and position result (+1,725). These figures are examples from the illustration. |
| 3 | SL BUY / BE / T |
Marks the Stop Loss (SL). BE means Break Even, and T means ticks. See Chapter 06 for management. |
| 4 | TRL |
Marks the position's Trail line. Chapter 06 explains how it works. |
| 5 | SL / TP with ticks |
Show the distance in ticks from the current price to Stop Loss (88 T) and Take Profit (138 T). |
| 6 | Trade / Size / Ticks |
Shows the trade result (Trade, +1,591), total size (Size, 3.00), and result in ticks (Ticks, +18). |
| 7 | Partial-position markers 2.00 and 1.00 |
Show the sizes of the partial positions at the right edge. The upper marker (2.00) belongs to the second order; the dimmed marker below it (1.00) belongs to the first. Together they make 3.00 lots. |
Trade and the position label show the same result, which changes continuously. At the moment a screenshot is taken, one of the displays may still show the previous value, so the figures in the illustration differ slightly.
To close the position, follow Chapter 05. To change Stop Loss, Take Profit, or Trail, follow Chapter 06.
Ctrl-click: Market Order with additional volume#
If you hold down Ctrl while clicking BUY or SELL, StereoTrader also sends a Market Order in the selected direction. The order then includes the volume already open in the same direction for the current symbol and strategy context. The new order becomes a separate partial position.
Example: A BUY position of 1.00 lot is open, and Volume is set to 1.00. Ctrl-clicking BUY sends a Market Order for 2.00 lots. The new partial position is 2.00 lots, bringing the total position to 3.00 lots, as shown in the illustration in the open-position section. The Volume field remains at 1.00; the additional volume applies to this order only.
A normal click sends only the size shown in Volume.
How a Ctrl-click affects opposing positions depends on the selected Trading model. In the Hedge models, opposing positions generally remain open. In other models, the order may reduce existing opposing volume. Chapter 03 explains the differences between the models.
Important: Ctrl-click applies to the current symbol and strategy context. It does not close every position in the account. Also, do not confuse it with
RV(Reverse) in Chapter 05, which reverses an open position.
Shift-click: Market Trail Order (MTO)#
If you hold down Shift while clicking BUY or SELL, StereoTrader does not send an immediate Market Order. Instead, you place a Market Trail Order (MTO).
An MTO is a stop trigger in the selected direction that follows the price at a fixed distance. This distance is called MTO distance and is specified in ticks. While the price moves against the selected direction, the trigger follows it.
Simplified BUY MTO example: MTO distance is set to 10 ticks. The trigger sits 10 ticks above the price. If the price falls by 5 ticks, the trigger follows it down by 5 ticks and stays 10 ticks above the price. If the price then rises back to the trigger, the order is triggered and a position is opened.
The difference from a Market Order is the timing:
- Market Order (normal click): The position opens immediately at the current market price.
- MTO (Shift-click): No position exists until the trigger is reached. The trigger follows the price while it moves against the selected direction.
Set MTO distance in the chart settings.
Important: An MTO is triggered only when the price reaches its trigger. No position is open before then. Check the direction, size, and
MTO distancebefore using Shift-click.
Related features#
This chapter covers opening a position from the trading panel. Related topics are covered in:
- Trading models and opposing-position behavior: Chapter 03
- Closing positions, Flat, Reset, and RV: Chapter 05
- Stop Loss, Take Profit, Trail, Break Even, and ATM: Chapter 06
- Pending Orders and Grid Orders: Chapter 07
- Using the Scalping Terminal: Chapter 08
- Quicksize and chart settings: Chapter 13