


 USER GUIDE · EN
Chart settings apply to the current chart and its selected strategy. Symbol Settings stores values for the relevant symbol. For global account and environment defaults, see Chapter 14.
Chart toolbar#
The chart toolbar combines settings and tools for the current chart. Its items are, in order: Current Settings, Clock, A/P, Reload, SYM, Strategy Manager, Arrange Charts, and Statistics.

| No. | Label | Description |
|---|---|---|
| 1 | Current Settings |
Opens the settings for the current chart and its strategy. |
| 2 | Clock |
Shows the time for the current chart. |
| 3 | A/P |
Switches this chart between Active and Passive. |
| 4 | Reload |
Reinitializes StereoTrader on this chart and reloads its settings. |
| 5 | SYM |
Opens the symbol settings for the chart's instrument. |
| 6 | Strategy Manager |
Opens strategy management; see Chapter 10 for details. |
| 7 | Arrange Charts |
Arranges the open chart windows according to the saved layout. |
| 8 | Statistics |
Opens the statistics view; Chapter 16 explains its filters and metrics. |
Clock shows the time for the current chart. Configure the server time zone under BROKER; see Chapter 14.
Reload reloads StereoTrader on this chart and reads its settings again. It does not close positions or delete Pending Orders. It is not a Reset or Panic command, and it does not affect other charts.
SYM in the toolbar opens Symbol Settings. The identically named control in the CHART panel instead shows or hides symbol-related lines.
Active and Passive#
Use A/P to choose whether the current chart is Active or Passive. A stands for Active and provides the chart's trading functions. P stands for Passive: the chart remains available for viewing and monitoring, but its trading, terminal, and grid functions are not available in the same way.
In the Passive state, the StereoTrader panel switches to a reduced view. Under Current Settings, only LAYOUT remains as a relevant settings group.
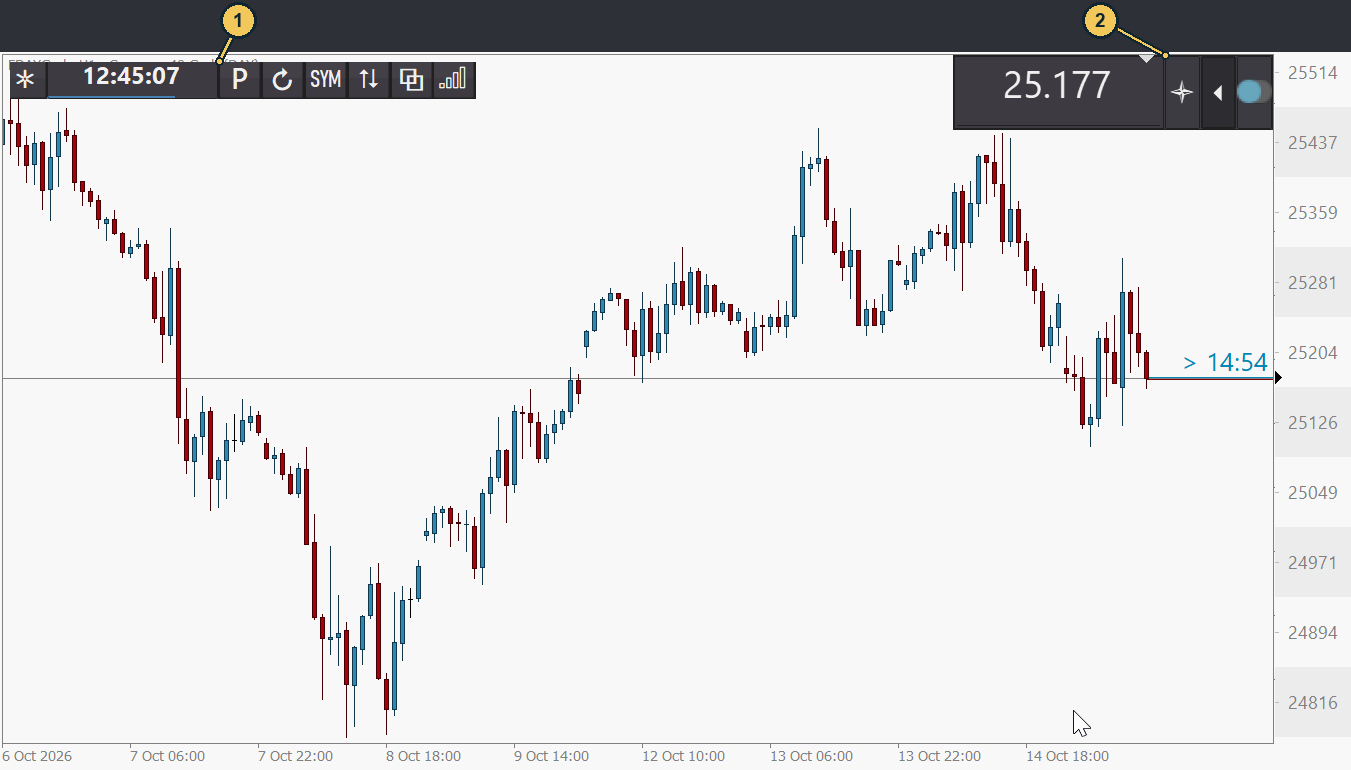
| No. | Label | Description |
|---|---|---|
| 1 | P |
Indicates that this chart is in Passive mode. |
| 2 | Reduced StereoTrader panel | Is used for viewing and monitoring in Passive mode. |
Current Settings#
Current Settings opens settings for the chart and its strategy. They override the defaults from GLOBAL for this chart only. In the active state, the groups are TRADING, TERMINAL, GRID ORDERS, and LAYOUT.
TRADING includes, among other settings, the additional distance after Break Even (BE) in BE save add and the distance for a Market Trail Order (MTO) in MTO distance.
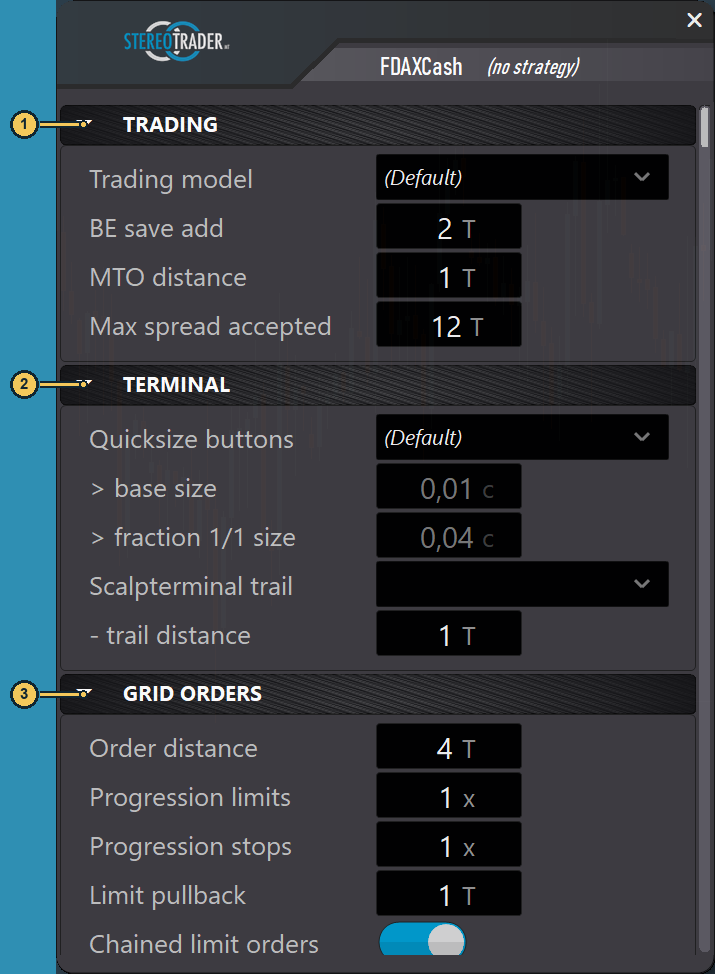
| No. | Label | Description |
|---|---|---|
| 1 | TRADING |
Contains chart-specific trading parameters. |
| 2 | TERMINAL |
Contains sizing and Scalping Terminal settings. |
| 3 | GRID ORDERS |
Contains parameters for the size and spacing sequence of Grid Orders. |
Apply changes and values applied immediately#
Not every change waits for Apply changes. Changes to BE save add, MTO distance, Max spread accepted, Scalpterminal trail, - trail distance, the fields in GRID ORDERS, and Chart theme are applied immediately.
For Trading model, Quicksize buttons, > base size, and > fraction 1/1 size, StereoTrader instead collects pending changes. When Apply changes appears, click it to apply these changes. The button is therefore not a general save step for every field.
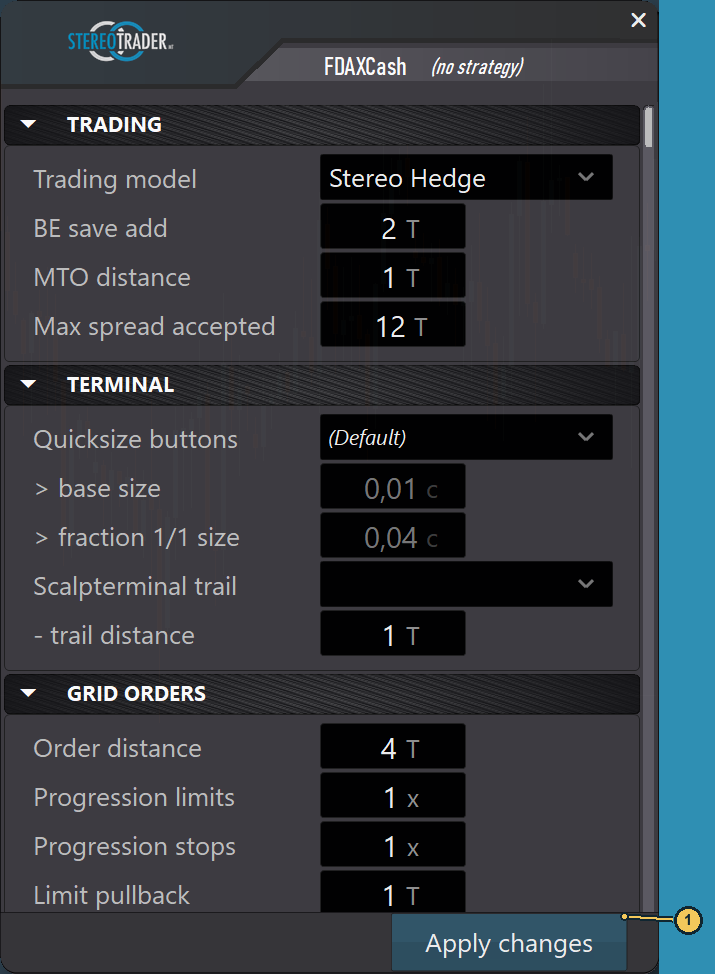
| No. | Label | Description |
|---|---|---|
| 1 | Apply changes |
Applies settings that are waiting for confirmation. |
TRADING#
The TRADING group contains the trading model selection, chart-specific distances, and a spread limit.
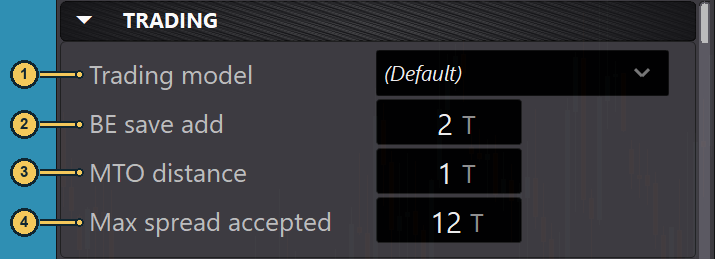
| No. | Label | Description |
|---|---|---|
| 1 | Trading model |
Selects the trading model for this chart on hedge accounts. |
| 2 | BE save add |
Sets the additional tick distance for the Break Even protection. |
| 3 | MTO distance |
Sets the distance for the Market Trail Order. |
| 4 | Max spread accepted |
Limits the spread at which new trades are allowed. |
On hedge accounts, use Trading model to select the model for this chart. On other account types, the field is disabled and Stereo Future is preset. A specific selection overrides the global default for this chart; Chapter 03 explains the available models and how they work.
BE save add determines how many additional ticks the stop is moved into profit after the Break Even trigger. The trigger itself is a separate setting. Chapter 06 explains how to apply Break Even (BE).
MTO distance sets the distance in ticks for a Market Trail Order (MTO). Chapter 04 explains how to trigger an MTO.
Max spread accepted sets the spread limit in ticks for new trades. If the spread is above the configured value, StereoTrader blocks new trades; trades are allowed up to and including the limit.
TERMINAL#
In TERMINAL, choose how Quicksize buttons offer position sizes and which Trail selection the Scalping Terminal uses.
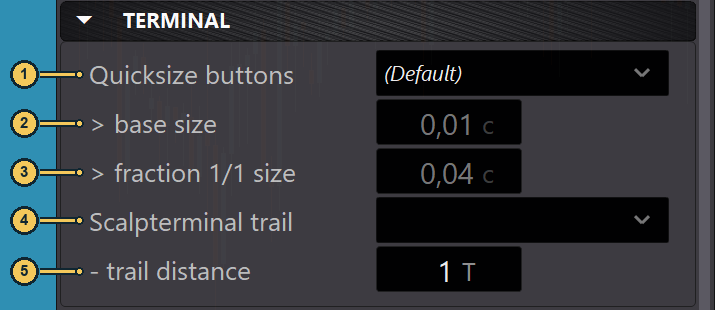
| No. | Label | Description |
|---|---|---|
| 1 | Quicksize buttons |
Selects the type of size buttons on the chart. |
| 2 | > base size |
Sets the base size for the standard mode. |
| 3 | > fraction 1/1 size |
Sets the value for the 1/1 size. |
| 4 | Scalpterminal trail |
Selects the Trail method for the Scalping Terminal. |
| 5 | - trail distance |
Sets the tick distance for the selected Trail method. |
Quicksize buttons provides a chart-specific selection for the quick sizes in the trading panel. The chart selection (Default) uses the global default. None selects no Quicksize variant. Normal (std) is the standard size selection; By risk low, By risk med, and By risk hi are the available risk-based variants; and As fractions selects sizes as fractions. Available options may vary with the active functions; the specific size calculation depends on the selected variant.
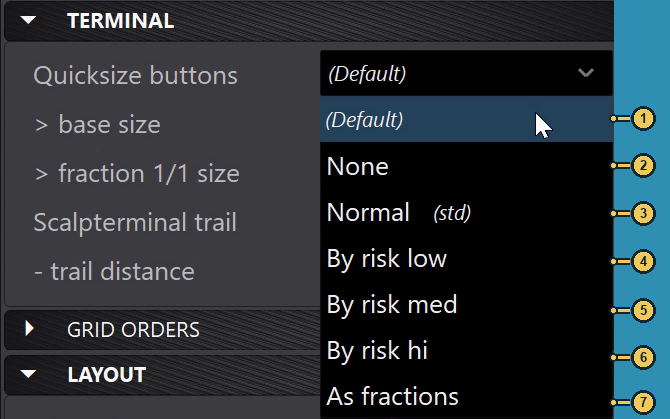
| No. | Label | Description |
|---|---|---|
| 1 | (Default) |
Uses the global Quicksize default. |
| 2 | None |
Selects no Quicksize variant. |
| 3 | Normal (std) |
Selects the standard size variant. |
| 4 | By risk low |
Selects the displayed low-risk variant. |
| 5 | By risk med |
Selects the displayed medium-risk variant. |
| 6 | By risk hi |
Selects the displayed high-risk variant. |
| 7 | As fractions |
Selects Quicksize steps as fractions of a size. |
> base size sets the base size for Normal (std). > fraction 1/1 size sets the value for the full 1/1 size. Both fields can be edited only when Normal (std) is selected.
Scalpterminal trail determines which Trail method the Scalping Terminal uses. The visible variants include None, Straight (TA1), and Tick Average (TA) entries TA 6, TA 12, and TA 20. Available options may vary with the active functions. For the Trail method and how to use it in the Scalping Terminal, see Chapter 06 and Chapter 08.
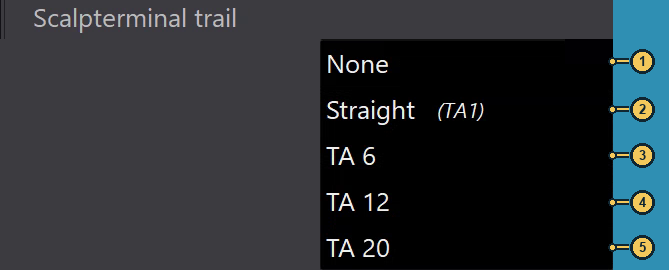
| No. | Label | Description |
|---|---|---|
| 1 | None |
Selects no Trail method. |
| 2 | Straight (TA1) |
Selects the displayed Straight variant. |
| 3 | TA 6 |
Selects the displayed Tick Average variant with a value of 6. |
| 4 | TA 12 |
Selects the displayed Tick Average variant with a value of 12. |
| 5 | TA 20 |
Selects the displayed Tick Average variant with a value of 20. |
- trail distance sets the tick distance used by the selected method in the Scalping Terminal. Chapter 08 explains how to use the panel.
GRID ORDERS#
GRID ORDERS contains chart-specific parameters for the spacing and size sequence of multiple Pending Orders. The following fields set the grid options; Chapter 07 explains how to place a grid and manage individual orders.
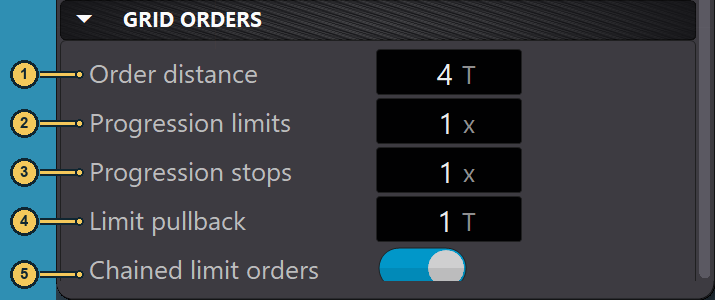
| No. | Label | Description |
|---|---|---|
| 1 | Order distance |
Sets the distance between Grid Orders in ticks. |
| 2 | Progression limits |
Controls the size progression of Limit Orders. |
| 3 | Progression stops |
Separately controls the size progression of Stop Orders. |
| 4 | Limit pullback |
Determines how a Limit Order follows the market and triggers after its price level is reached. |
| 5 | Chained limit orders |
Determines whether other Limit Orders move with a Limit Order as it follows the market. |
Order distance sets how many ticks separate the price levels of the Grid Orders. Progression limits and Progression stops independently control how the sizes of successive Limit and Stop Orders change.
Limit pullback applies to Limit Orders: after the intended level is reached, the order can follow the market. The configured tick distance determines when a subsequent move in the opposite direction triggers the execution. If Chained limit orders is enabled, subsequent Limit Orders follow this movement so that the spacing within the grid is maintained. Chapter 07 explains the full procedure and its effects on pending orders.
LAYOUT#
The chart-specific LAYOUT group contains Chart theme. Use it to select a theme for the current chart. (Default) uses the theme from GLOBAL; another selection overrides it for this chart.

| No. | Label | Description |
|---|---|---|
| 1 | Chart theme |
Selects this chart's appearance; (Default) follows the global theme. |
Chart label contrast is under GLOBAL → LAYOUT and is explained in Chapter 14.
CHART panel#
The CHART panel groups tools for navigation, scaling, and displaying price, volume, and chart information. The overview markers show the groups; their individual functions are explained below.
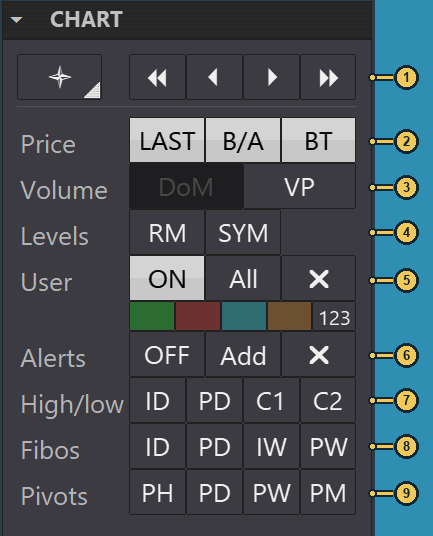
| No. | Area | Description |
|---|---|---|
| 1 | Navigation / Scaling | Quick chart navigation and vertical scaling. |
| 2 | Price |
Price line, Bid/Ask lines, and candle time remaining. |
| 3 | Volume |
Depth of Market and Volume Profile. |
| 4 | Levels |
Round Marks and symbol-related lines. |
| 5 | User |
Display and quick editing of user objects. |
| 6 | Alerts |
Alert switch, adding, and removing alerts. |
| 7 | High/low |
High and low points for selected periods. |
| 8 | Fibos |
Fibonacci displays for selected periods. |
| 9 | Pivots |
Pivot displays for selected periods. |
Navigation and Scaling#
The <<, <, >, and >> buttons quickly move the chart view backward or forward. The double-arrow buttons jump farther than the single-arrow buttons.
Scaling changes the chart's vertical scale or position. Ctrl-click Scaling to switch to Scalp scaling.
Price#
LAST shows or hides the last-price line. B/A displays shortened Bid and Ask lines. BT shows the time remaining for the current candle and is available only when B/A is enabled.
Volume: DoM and Volume Profile#
DoM stands for Depth of Market. On an active chart, with a supported timeframe up to and including H1 and suitable market data, this area displays market depth.
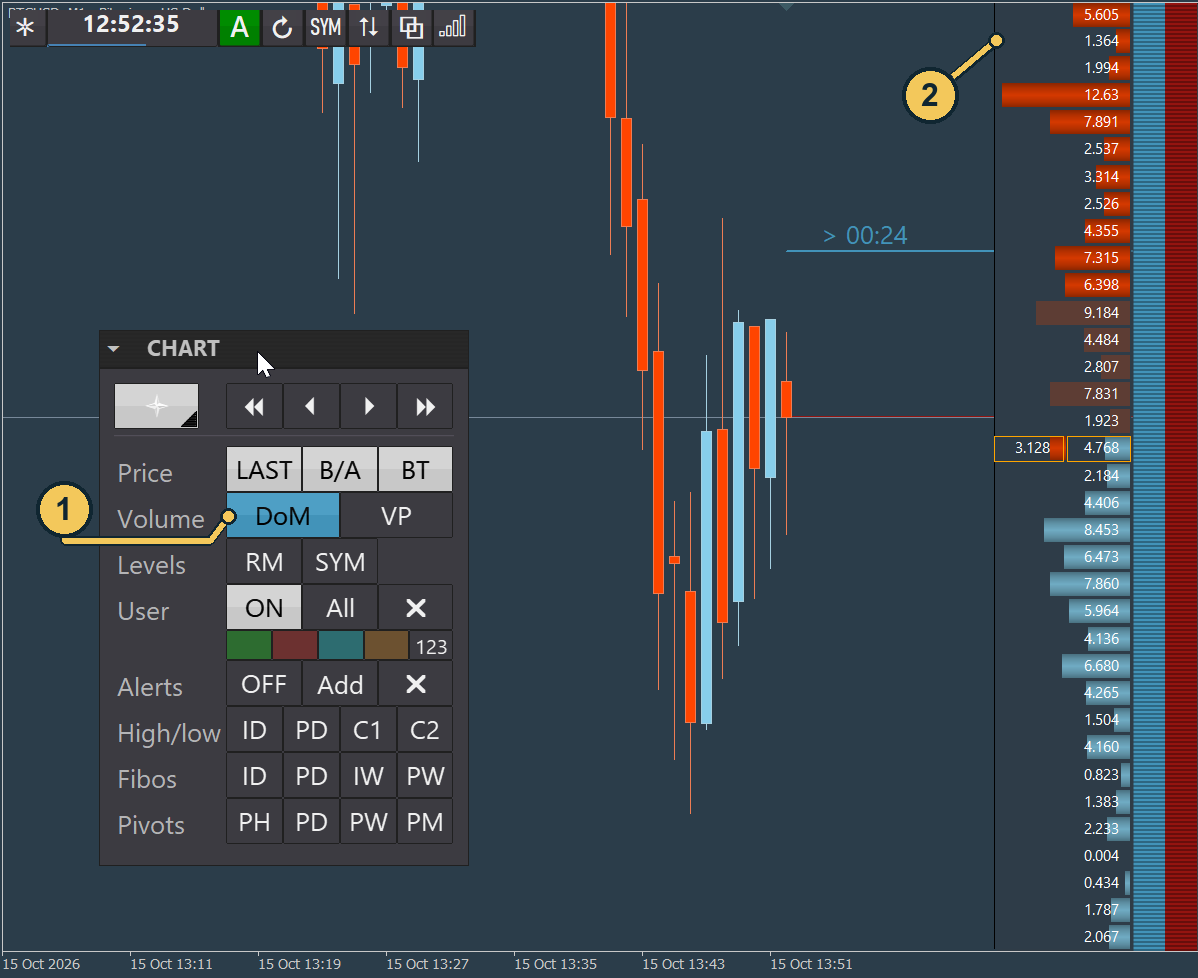
| No. | Label | Description |
|---|---|---|
| 1 | DoM |
Turns the market-depth display on. |
| 2 | Market depth | Shows the market data available for the chart. |
VP stands for Volume Profile. It shows the volume profile on the chart. Ctrl-click VP to rebuild the profile. The volume data used depends, among other things, on Volume source in Symbol Settings.
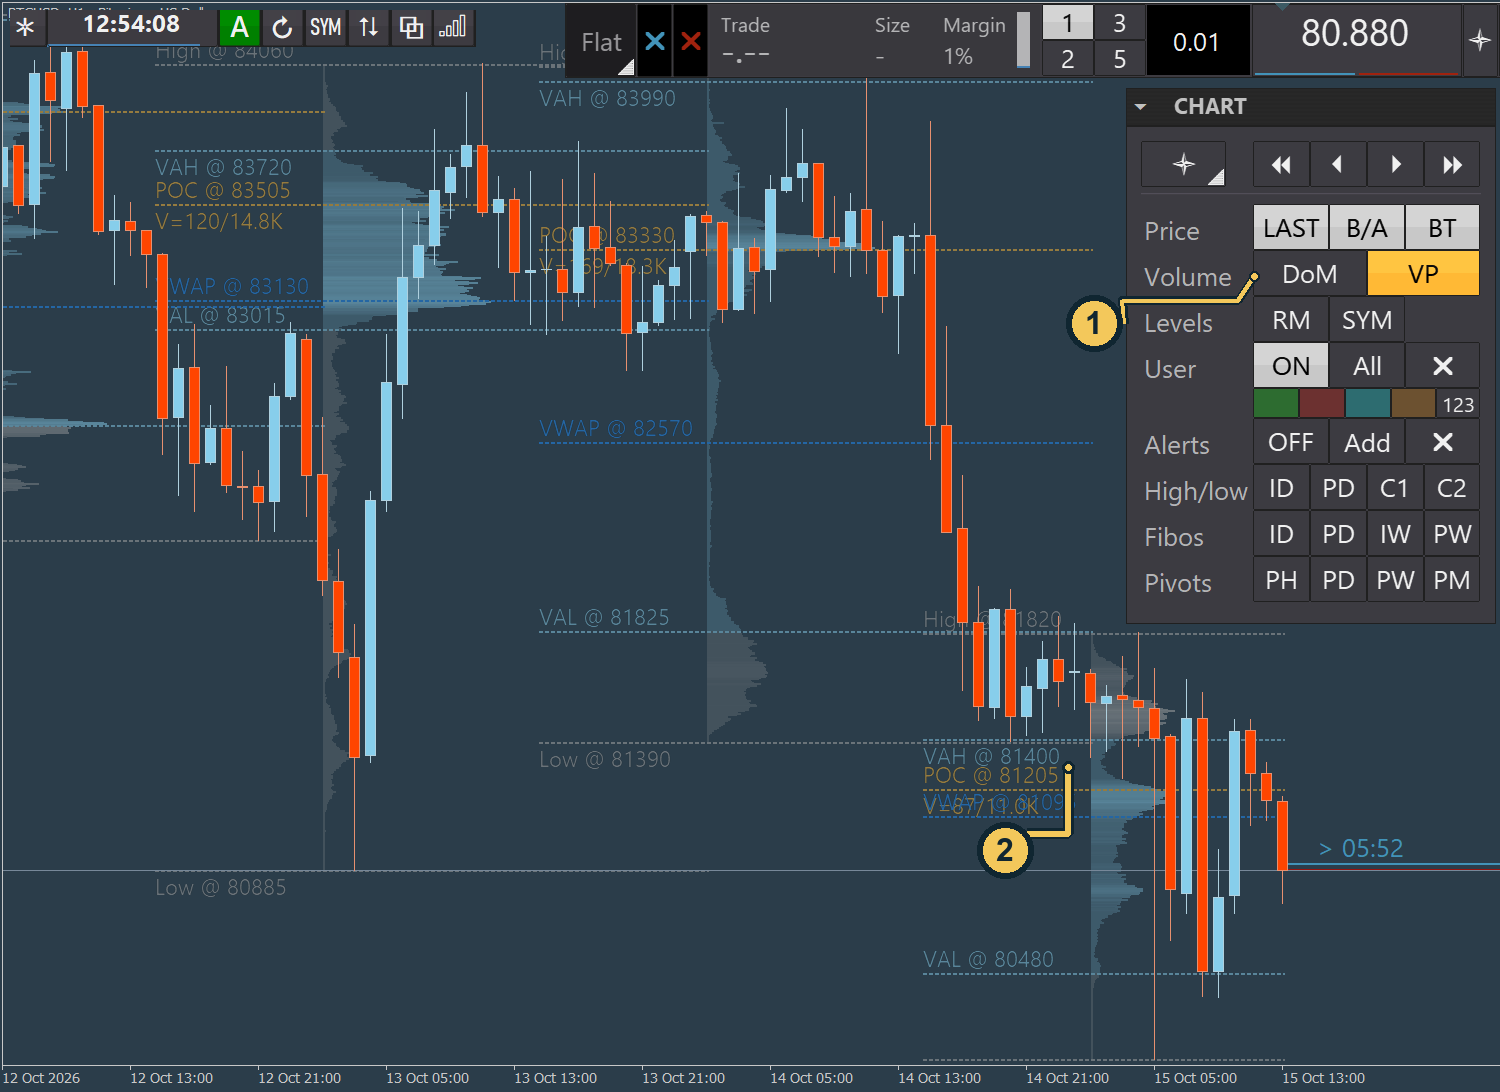
| No. | Label | Description |
|---|---|---|
| 1 | VP |
Turns on the Volume Profile display. |
| 2 | Volume Profile | Shows the profile of the volume data used on the chart. |
Levels#
RM stands for Round Marks. It shows or hides price markers at fixed intervals. SYM in the CHART panel shows or hides symbol-related lines. This control has a different effect from SYM in the toolbar, which opens Symbol Settings.
User objects#
The User area controls the display and quick editing of user objects. ON and OFF turn the display on and off. Use All to show objects across all timeframes, or select the desired timeframe. X removes user objects. The four colored buttons provide type-specific quick actions for selected lines and rectangles. 123 adds a price display to the selected line or rectangle object.
Alerts#
Alerts controls alert lines on the chart. ON and OFF turn the alert area on and off, Add adds an alert line, and X removes alerts. The lines mark price areas where you want an alert.
High/low, Fibos, and Pivots#
High/low shows highs and lows for the selected period. ID stands for Intraday and shows the day's high and low; PD stands for Previous Day and shows the previous day's high and low. C1 and C2 select the first and second subchart, respectively.
Fibos shows Fibonacci levels for one of the available periods. ID stands for Intraday, PD for Previous Day, IW for Current Week, and PW for Previous Week.
Pivots shows pivot levels for one of the available periods. PH stands for Previous Hour, PD for Previous Day, PW for Previous Week, and PM for Previous Month.
Symbol Settings#
SYM in the chart toolbar opens Symbol Settings for the instrument on the current chart. The saved values are specific to the symbol and are used for chart calculations and volume displays.
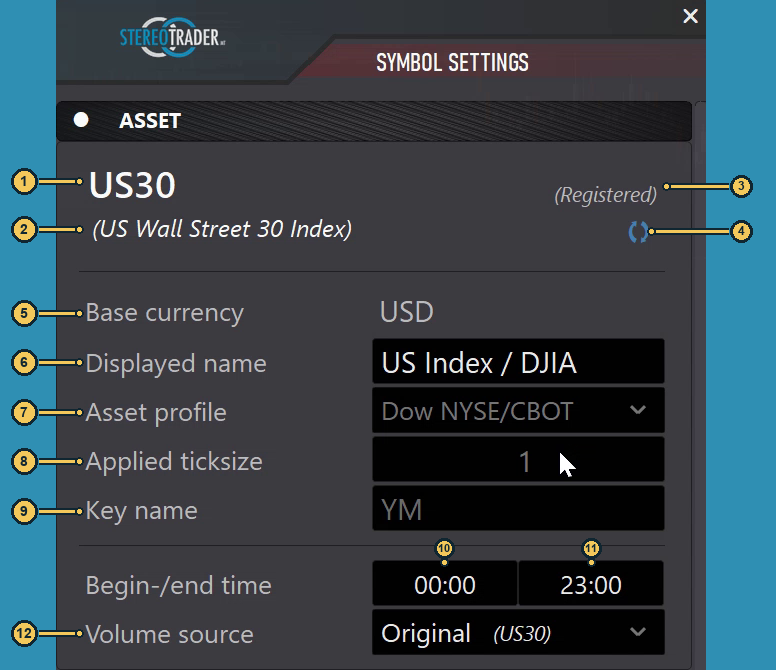
| No. | Label | Description |
|---|---|---|
| 1 | Symbol name | Read-only name of the selected instrument, for example US30. |
| 2 | Symbol description | Read-only description of the instrument, for example (US Wall Street 30 Index). |
| 3 | Registered |
Shows the registration status, which affects which fields can be edited. |
| 4 | Refresh |
Applies the available broker and symbol defaults for this symbol and reloads the fields. |
| 5 | Base currency |
The symbol's currency; this field is read-only. |
| 6 | Displayed name |
The displayed symbol name; this field can be changed. |
| 7 | Asset profile |
Symbol profile; this field is read-only when Registered, otherwise it can be selected. |
| 8 | Applied ticksize |
Shows the applied tick size. This field is read-only when Registered; otherwise, editability depends on the symbol type. |
| 9 | Key name |
Shows the key name stored for the symbol; the field is locked when Registered, otherwise it can be edited. |
| 10 | Start under Begin-/end time |
Start of the trading interval; can be edited if needed. |
| 11 | End under Begin-/end time |
End of the trading interval; can be edited if needed. |
| 12 | Volume source |
Selects the volume data source for the symbol. |
Base currency is a display value and cannot be changed. Displayed name can be edited. When Registered, Asset profile, Applied ticksize, and Key name are read-only or locked. For other symbols, you can select Asset profile; whether Applied ticksize can be edited depends on the symbol type. Key name can be edited for these symbols. Refresh applies the available broker and symbol defaults and reloads the fields.
The two values under Begin-/end time set the start and end of the trading interval used for the symbol. They do not have to match the full exchange opening hours. These times affect time-based chart calculations, including Fibos and Pivots.
Volume source selects the source for volume data. Among other things, it affects the data shown for DoM, VP, and other volume displays. Available sources depend on the data available for the symbol.
After changing symbol values, click Apply. StereoTrader saves the symbol settings and updates the current chart.
Practical notes and cross-references#
Before changing a setting, check whether it applies to the chart, the symbol, or global defaults. Current Settings and Symbol Settings have different scopes; global themes, account settings, and server settings are covered in Chapter 14.
For Trading Models, see Chapter 03; for Market Orders and MTO, Chapter 04; for Break Even and Trail, Chapter 06; for Grid Orders, Chapter 07; for the Scalping Terminal, Chapter 08; for strategies, Chapter 10; and for statistics, Chapter 16.